
Introduction to Reports
If you manage a team, two questions you probably whisper to yourself all the time are:
- What has my team been working on?
- How have we been performing lately?
Whereas the Calendar can help answer the first question, Reports can help answer the second. Reports provide a birds-eye view of your team’s progress over time, which can be useful for project managers or any other type of team lead looking to get a quick "pulse" on a particular project or mailbox. This is especially helpful if you work remotely and need to gain some insight from afar.
To get started, click on Reports in the upper left-hand corner of your dashboard.

Setting up your report
Select a mailbox or project
When you arrive at your Reports Dashboard, it will automatically generate a report for your first mailbox or project. To change which report you'd like to run, simply select a mailbox or project from the dropdown menu on the left-hand side of the page and hit Run Report.

Set a time frame
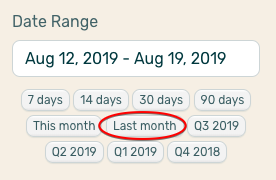
You can also choose a time frame for your report. It will always default to a week prior to the current date, but if, for example, you wanted to see how your team progressed last month, you could click on Last month in the Date Range section on the left-hand side. There are other pre-populated time frames available to select too, such as 7 days, 90 days, or a particular quarter.
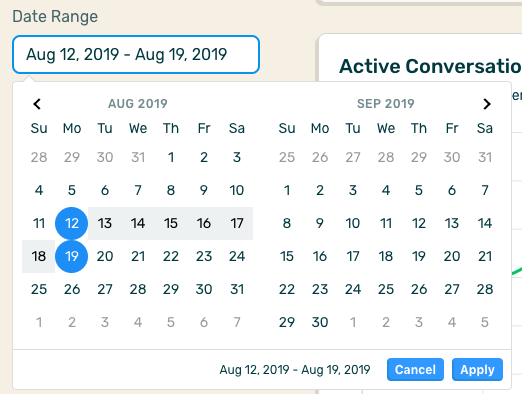
You can also create your own time frame by clicking on the Date Range and selecting the dates you'd like to be included in your report.
While the process to run a report is the same for both mailboxes and projects, the information that comes back is slightly different. Read on to learn more about the different types of information detailed in your reports.
Mailbox Reports
So you've selected a mailbox and a time frame and you're ready to read your report. Once you hit Run Report, your report will be generated on the right-hand side of the page. At the top of the page, you'll see a summary of the information that's detailed further down in the report. The date range will display at the top, followed by a snapshot of your team's stats during your selected time frame. There are a few key terms to understand here:
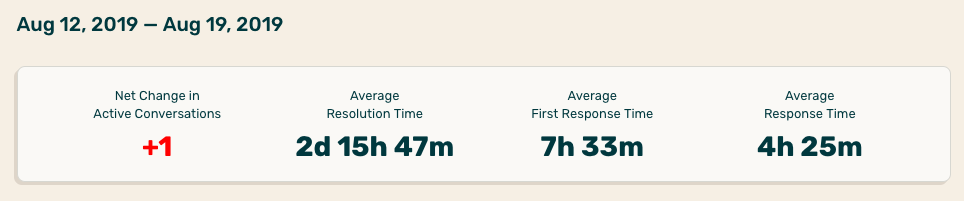
- Net Change in Active Conversations: the net change in active conversations over your selected time frame. For example, if you started out the week with five active conversations and ended the week with six, then you'd have a net change of (+1).
- Average Resolution Time: the average time it took to resolve conversations over the selected time frame. A resolved conversation is one that is currently set to an inactive status. In this example, the average time to resolve a conversation was 2 days, 15 hours, and 47 minutes.
- Average First Response Time: this is the average amount of time it took to first respond to initial messages over the selected time frame. Note that this may take weekends into account.
- Average Response Time: the average amount of time it took to respond to your conversations overall (not just the first response).
Active Conversations
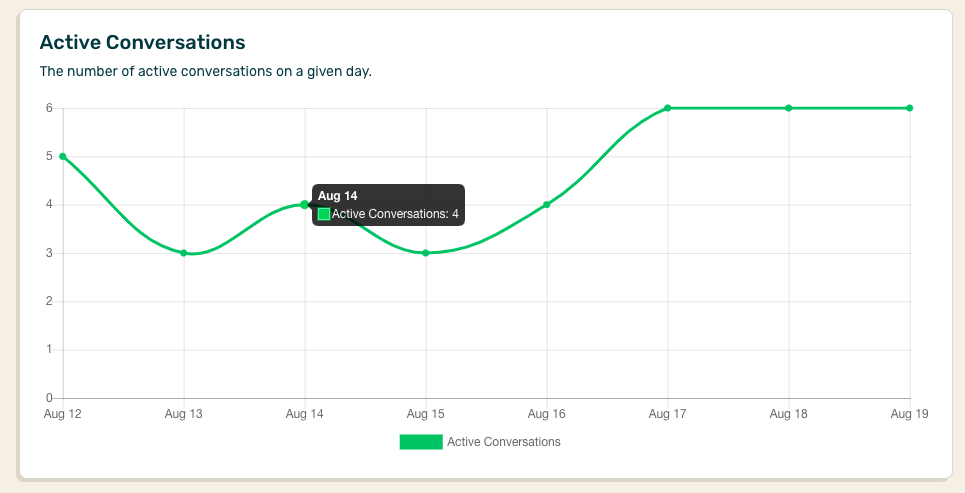
Further down into your report are additional stats mapped out in more detail. The Active Conversations graph shows the number of active conversations on any given day over your time frame. In this example, you can see that there were four active conversations on August 14.
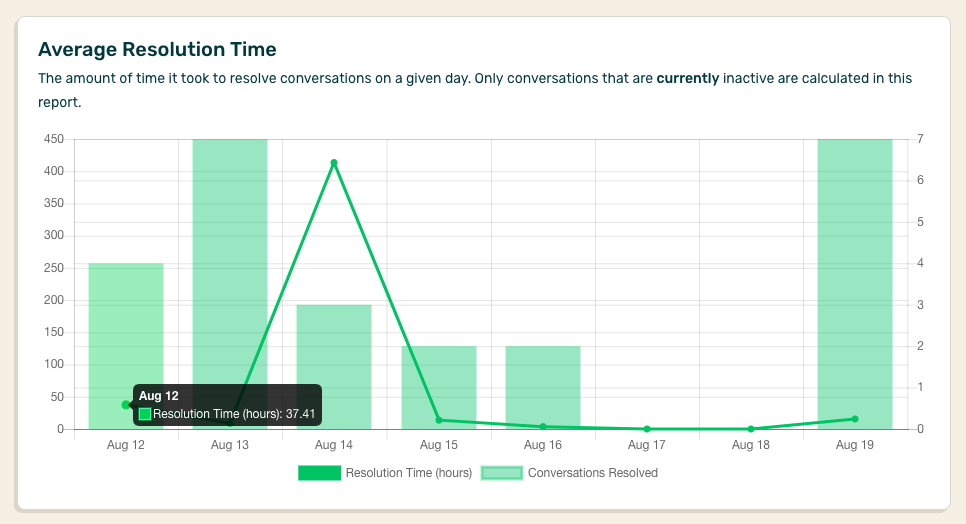
Average Resolution Time
In this graph, you'll see two types of information. The first piece of information is the number of conversations that were resolved on any given day during your time frame (light green bar). The second piece of information is the average time it took to resolve those conversations on any given day (dark green line). In this example, there were four conversations resolved on August 12, with an average resolution time of 37.41 hours.
First Response Time
This graph shows a breakdown of the average amount of time it took to respond to a customer's initial message on any given day during your time frame (dark green line). It also shows the number of total responses on any given day (light green bar). In this example, there were two responses to messages on August 16, with an average of 0.5 hours to first respond to those messages.

Average Response Time
Similar to First Response Time, this graph shows the number of responses on any given day (light green bar) and the average amount of time it took to respond to any message (dark green line). In this example, there were seven responses to messages on August 12, with an average response time of 14.16 hours.

Project Reports
The reported metrics for projects are similar to mailboxes, but more straightforward. Since there are no conversations in projects, task activity is tracked in order to gain an understanding of workload and efficiency. Similar to mailbox reports, you'll start out with a top-line summary at the top of your report. Along with the date range of your report, you'll see two pieces of information:
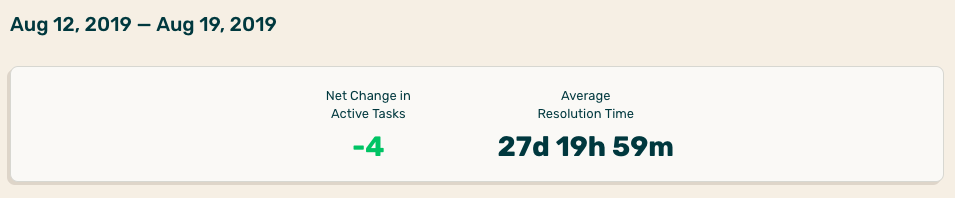
- Net Change in Active Tasks: this number is the net change in active tasks during your designated time frame. So, if you had 32 active tasks at the start of the week and 28 at the end of the week, the net change would be (-4).
- Average Resolution Time: this is the average amount of time it took to resolve all tasks during this time frame.
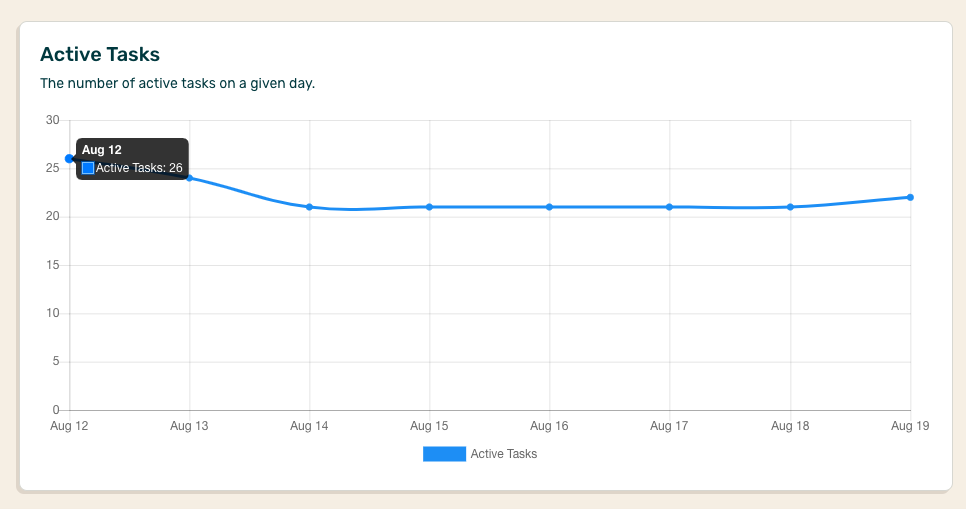
Active Tasks
This graph shows how many active tasks were open on any given day during your time frame. In this example, there were 26 active tasks open on August 12.
Average Resolution Time
This graph shows the number of tasks resolved (light blue bar) and the average amount of time it took to resolve those tasks on any given day during your time frame (dark blue line). In this example, there were three tasks resolved on August 14, with an average resolution time of 677.58 hours. You can see that there is probably room for improvement to resolve tasks more quickly based on this statistic 😃.
As you can see, Reports are a great way to quickly see how your team is progressing over time. Knowing this information can help ensure you're hitting goals and identifying any areas of inefficiency. Just pick a mailbox or project to see how many active items remained after each day and how quickly your team is responding to and resolving conversations and tasks!


.png)